
The skimming effect: why you won’t read this
I don’t think you’re going to read this blog post. Not properly READ* it, not every word. There is a reason for that- human beings are predominately lazy. They look for the quickest possible short cut in any task and reading is no exception. Luckily, we are also clever enough to pull out meaning under challenging conditions. For example, words don’t need to be spelt correctly in order for the correct meaning to be absorbed. In fact, one can randomise spelling and we can re-assemble the correct letter order and the meaning can still be divined. Look at the scrambled paragraph below provided by www.positscience.com
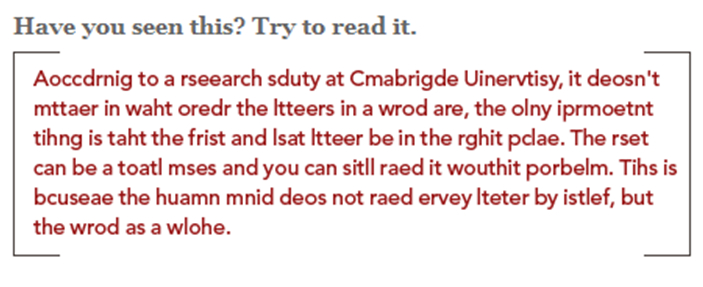
The scrambled paragraph is relatively easy to read – and this is not purely because the initial and the last letter in the word are intact. When you read it you take in the context of the adjacent words and assume continuity of meaning. In the same way, you can skim across a paragraph and develop an understanding without reading every single word.
Neuromarketers have understood for some time that users don’t actually read* everything. Jakob Nielsen undertook his first study of reading patterns on the web in 1997 comparing a traditional “marketing led” paragraph of text with 4 alternative formats. His hypothesis was that users prefer less subjectivity, shorter paragraphs, bulleted lists and a single idea presented per paragraph. To put this theory to the test he provided alternative formats of text content to a user panel and asked them to engage with the site. Below are displayed the original content and the test winner:
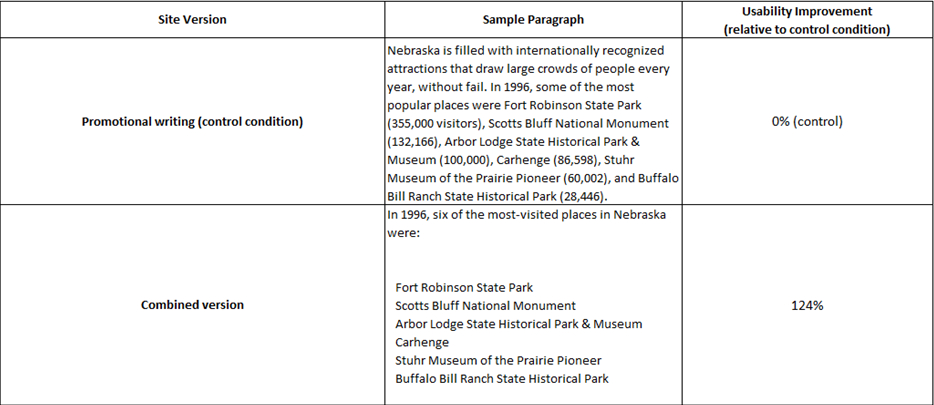
Nielsen concluded his study by stating:
“Our conjecture to explain this finding is that promotional language imposes a cognitive burden on users who have to spend resources on filtering out the hyperbole to get at the facts. When people read a paragraph that starts ‘Nebraska is filled with internationally recognized attractions,’ their first reaction is no, it’s not, and this thought slows them down and distracts them from using the site.”
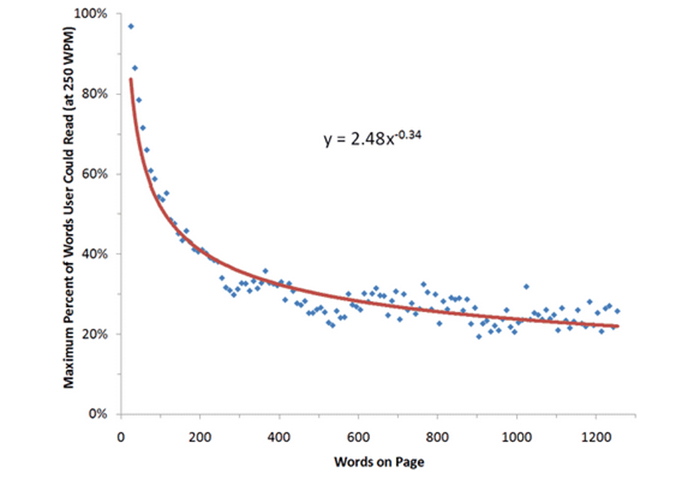
In 2008, Harald Weinreich’s team at the University of Hamburg attempted to put a mathematical value on interaction with text. Weinrach’s study measured the length of time users spent on web pages and a value for the maximum amount of text that could physically be read within that time. Users were asked to perform their normal day-to-day web tasks, so it was an entirely naturalistic study. The results were stark- given dwell times on the pages they navigated users could only ever have read about 28% of the content they were presented with. Jakob Nielsen worked with the Weinreich dataset and posits that 20% is more likely. Nielsen provides the following graph highlighting the decay of words actually read. There is a sharp drop off between 0 and 100 words, suggesting that in terms of text content you want read, then less is more.
In an age of content driven marketing this is perhaps a little scary. As digital marketers move their attention away from lists of keywords to calculating measures of content and engagement, it might be a little bit surprising that individual words are in competition for attention.
At Oban Conversion, we have run our own tests on readability using our bespoke Think-Track tool. Think-Track measures cognitive load and engagement on web pages using an occluded viewer and a tapping test. The larger the differential rate of tapping – faster or slower – the greater the indication is of a higher cognitive load (i.e. people find a task difficult to do). We’ve found evidence supporting the skimming theory.
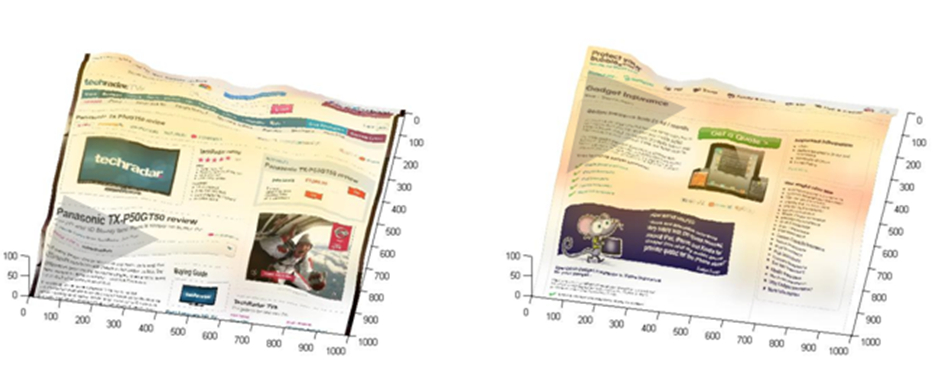
The graphs above show the webpages of Techradar and Protect Your Bubble run through our 3D- cognitive map generator. The highest level of cognitive load is shown by three-dimensional peaks, with the lowest level of cognitive load by troughs. In both cases the start of the text paragraph displays a cognitive peak highlighted by the grey triangles. However, the second half of each sentence- in fact the whole of the right hand side of the text block- shows low levels of cognition. This is consistent with readers starting to READ the opening part of the content block, but then skimming the rest.
Think-Track also provides directional mapping indicating the movement of the eye over the page. In the example on the left with a text heavy content block, users scan the content in a diagonal direction from top left to bottom right. They don’t move horizontally across the sentence as if reading every word. This is also consistent with users skimming rather than reading.
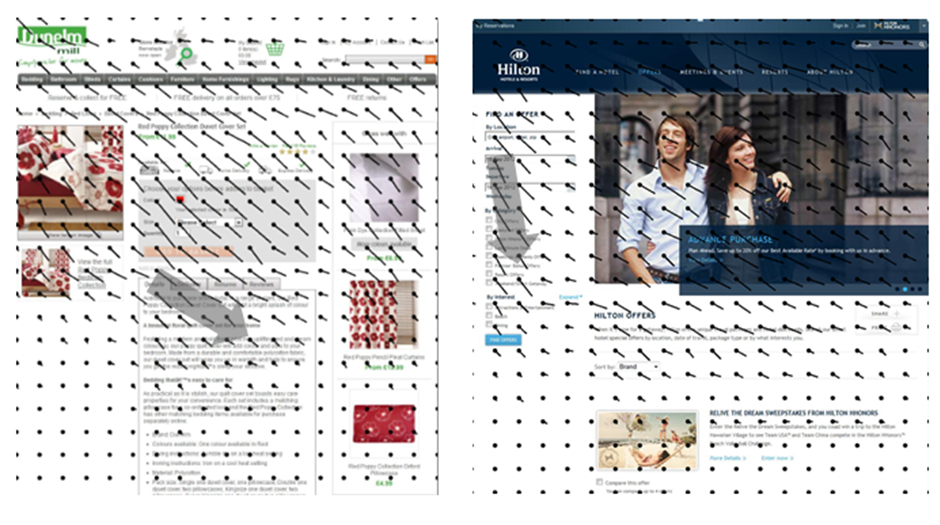
In the example on the right, there is a much more pronounced vertical movement top to bottom; the filter mechanism is in ‘easy to understand’ blocks so users can scan this vertically and make sense of it.
The conclusion that can be drawn for UX and conversion is this: blocks of text content are as much the part of the experience of web design as a hero image or a call to action button – and how one presents text* is as much of the design process too. After all, you’ve just skimmed most of this paragraph but read the word “text” because it’s highlighted, bold and italicised. This is a new and fascinating area for digital marketing as web masters learn that it’s not a debate between quantity or quality but design that makes the difference in getting across meaning. So the use of bullet pointed text, highlights, italics, font size and indentation are as much a part of the design experience as colour and imagery selection.
*see, I told you. Experiment with formats of emphasis to keep users engaged.
———-
See also:
– http://www.positscience.com/brain-resources/brain-teasers/scrambled-text
– http://www.uefap.com/reading/efficien/skim/skim.htm
– http://www.nngroup.com/articles/how-users-read-on-the-web/